Chart objects
Claris Studio provides various charts that let you visualize your record data in different ways depending on your needs. The table below shows the different types of charts and what you can use them for:
| Type | Purpose |
|---|---|
|
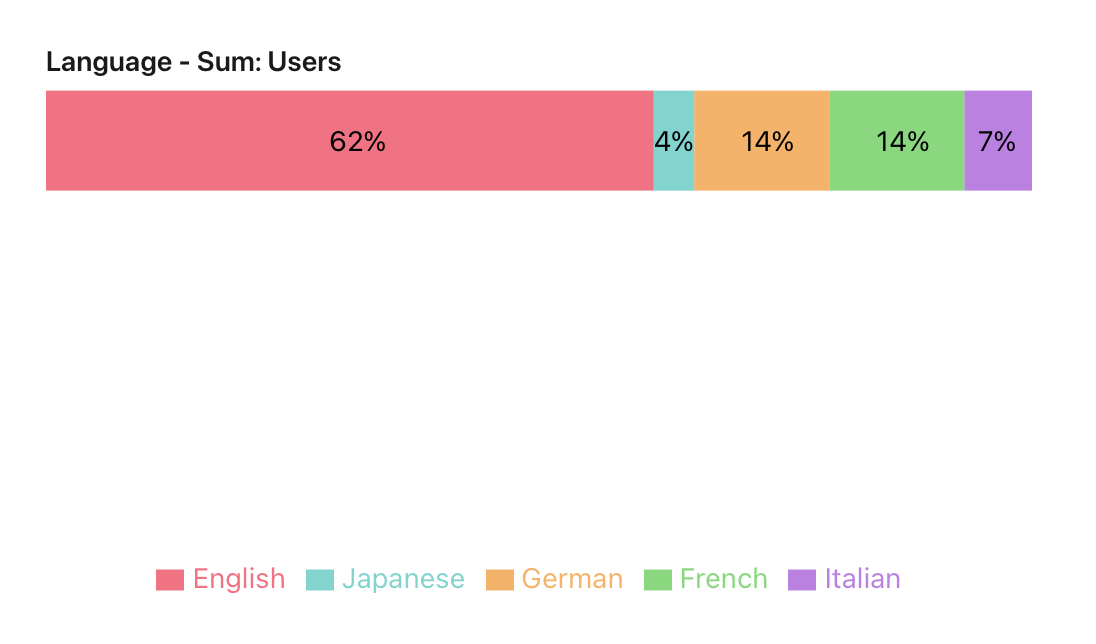
Segmented Bar - A bar chart where each bar is divided into segments representing different categories or subgroups.
|
To compare proportions within categories while also showing the total size of each category. Great for visualizing survey data, market share, or demographic breakdowns. |
|
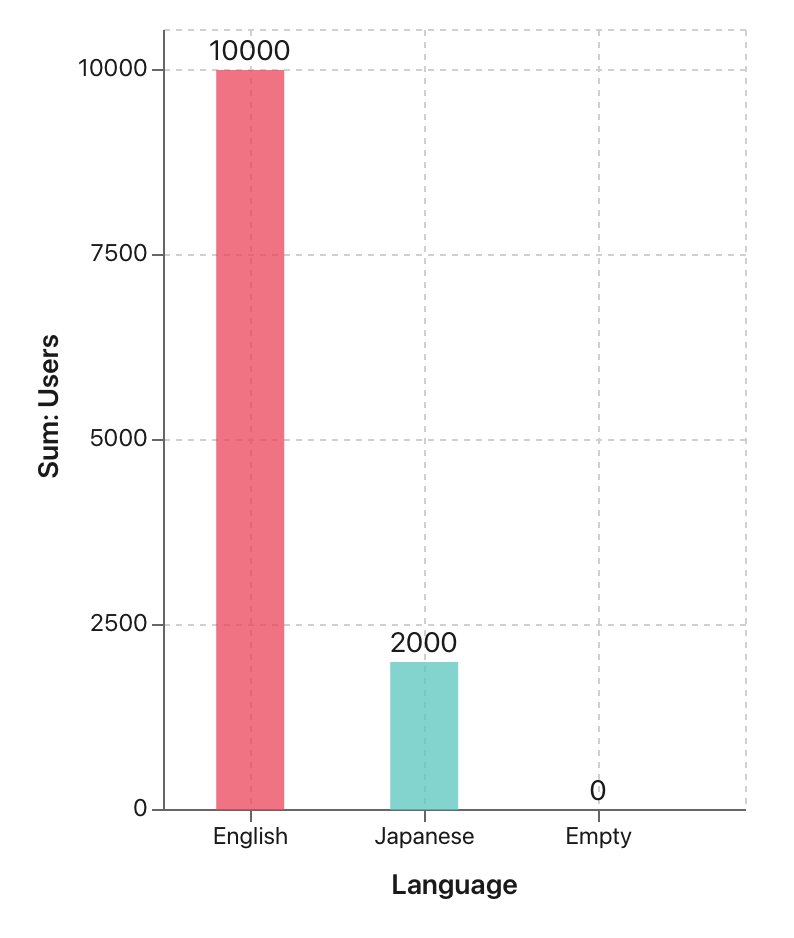
Bar Chart - Uses rectangular bars to represent data values, with length corresponding to value size.
|
To compare discrete categories or groups. Works well for categorical data, sales comparisons, and trends over time (when time isn’t the main focus) |
|
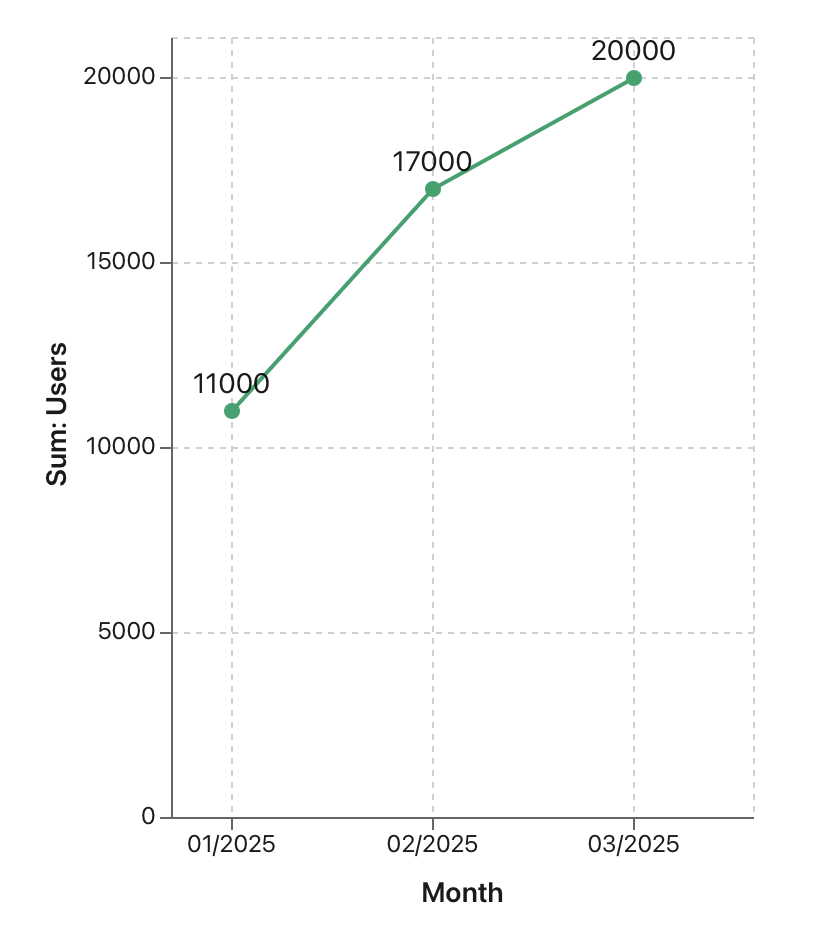
Line Chart - Uses points connected by lines to show trends over time.
|
To track continuous data trends, such as stock prices, website traffic, or temperature changes over time. |
|
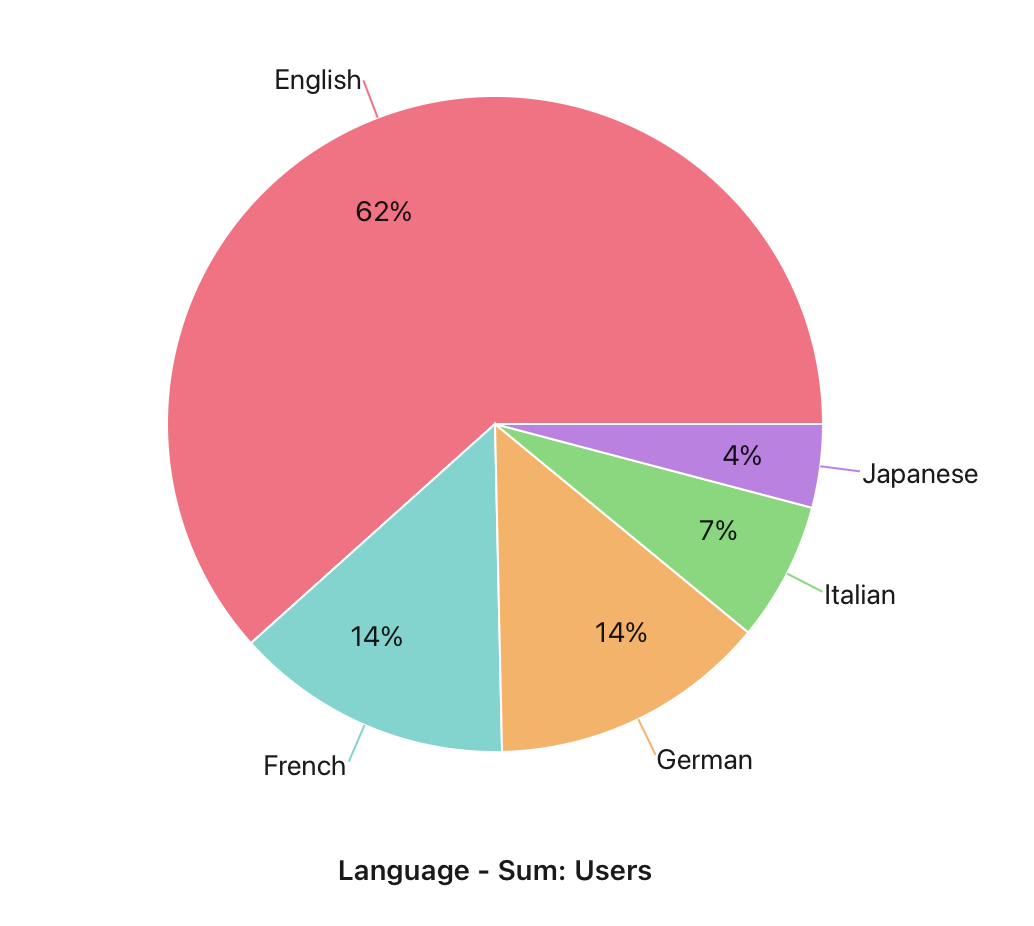
Pie Chart - A circular chart divided into slices representing proportions of a whole.
|
To show percentage-based distributions, like market share or budget allocations. Best for simple datasets with a few categories. |
|
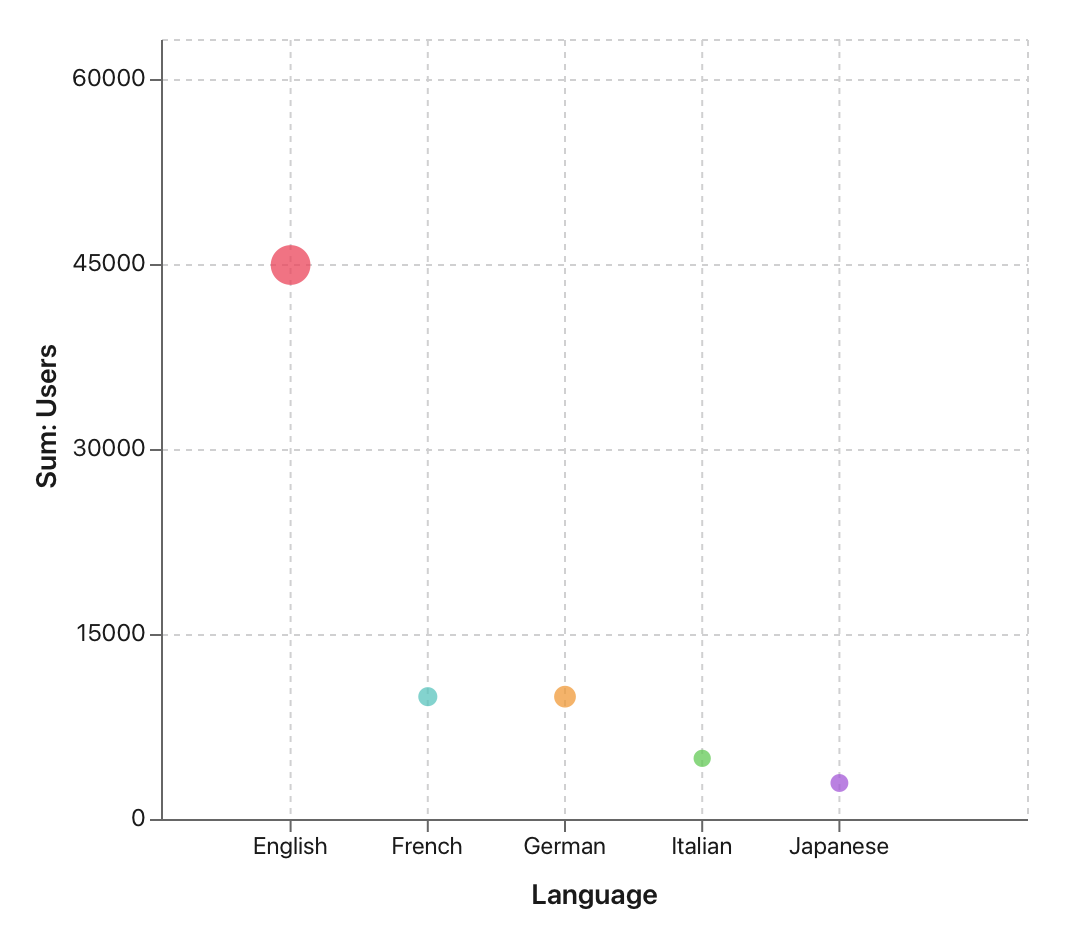
Bubble Chart - Similar to a scatter plot but with bubbles of varying sizes representing a third dimension of data.
|
To visualize relationships between three variables, like revenue (x-axis), profit (y-axis), and number of customers (bubble size). |
|
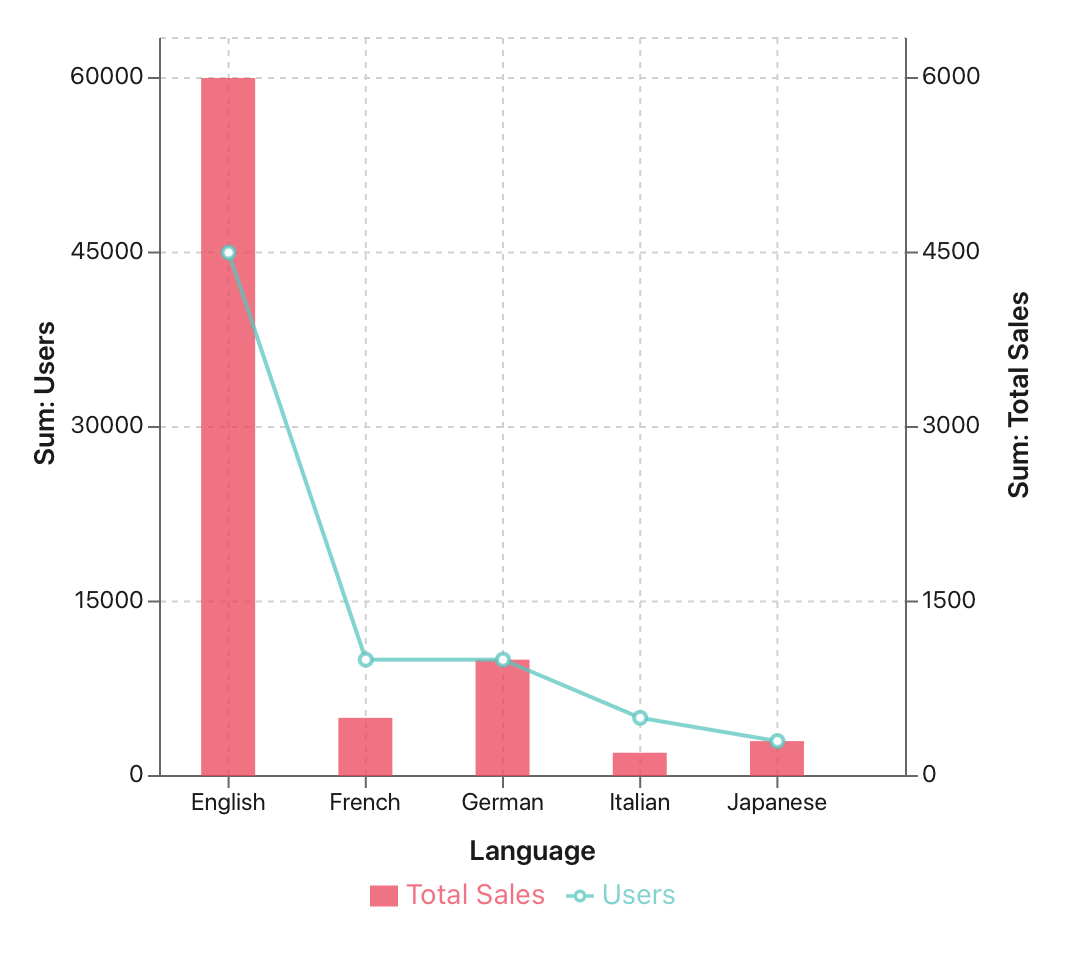
Combo Chart - A combination of two or more chart types (e.g., bar and line chart together).
|
To compare different types of data in one chart, such as sales figures (bars) alongside growth trends (lines). |